Resources


Highlights
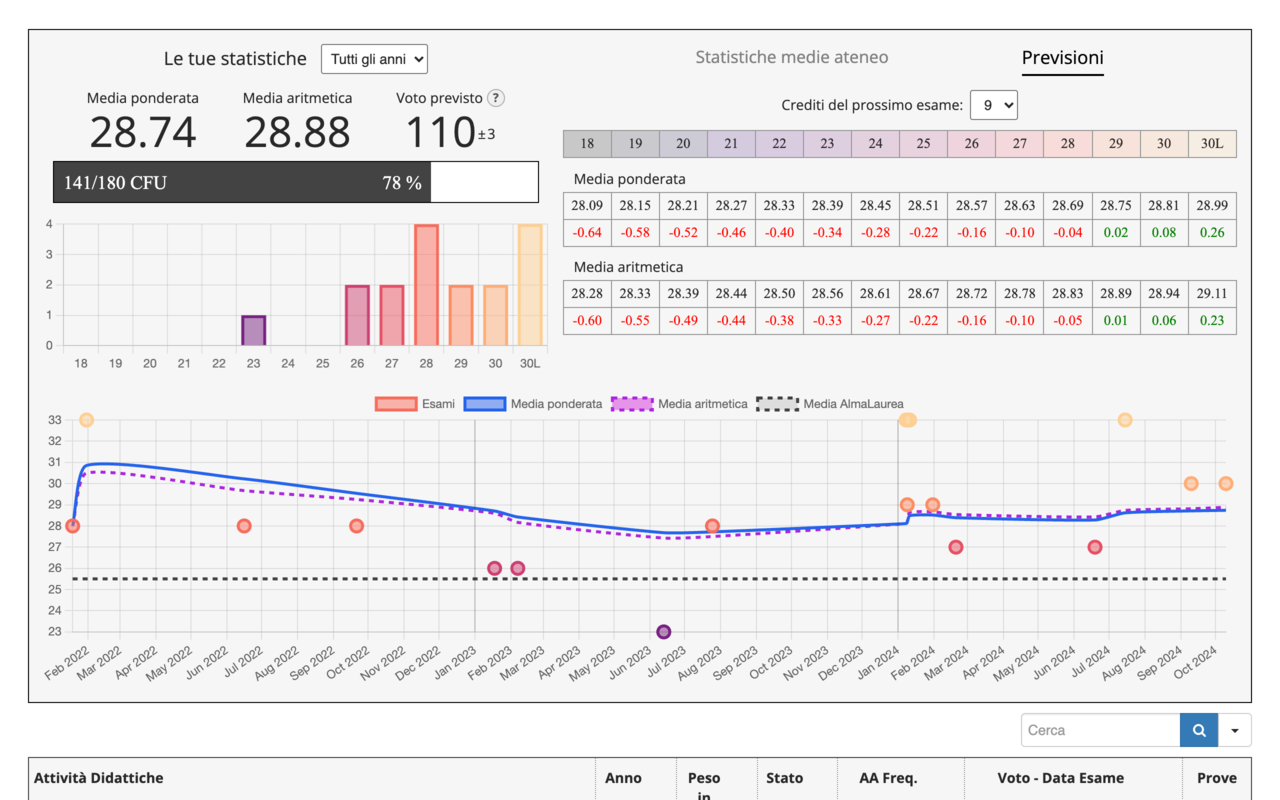
A dashboard shows the weighted average, the arithmetic average, the predicted final grade, the grade distribution chart and the grade progression chart
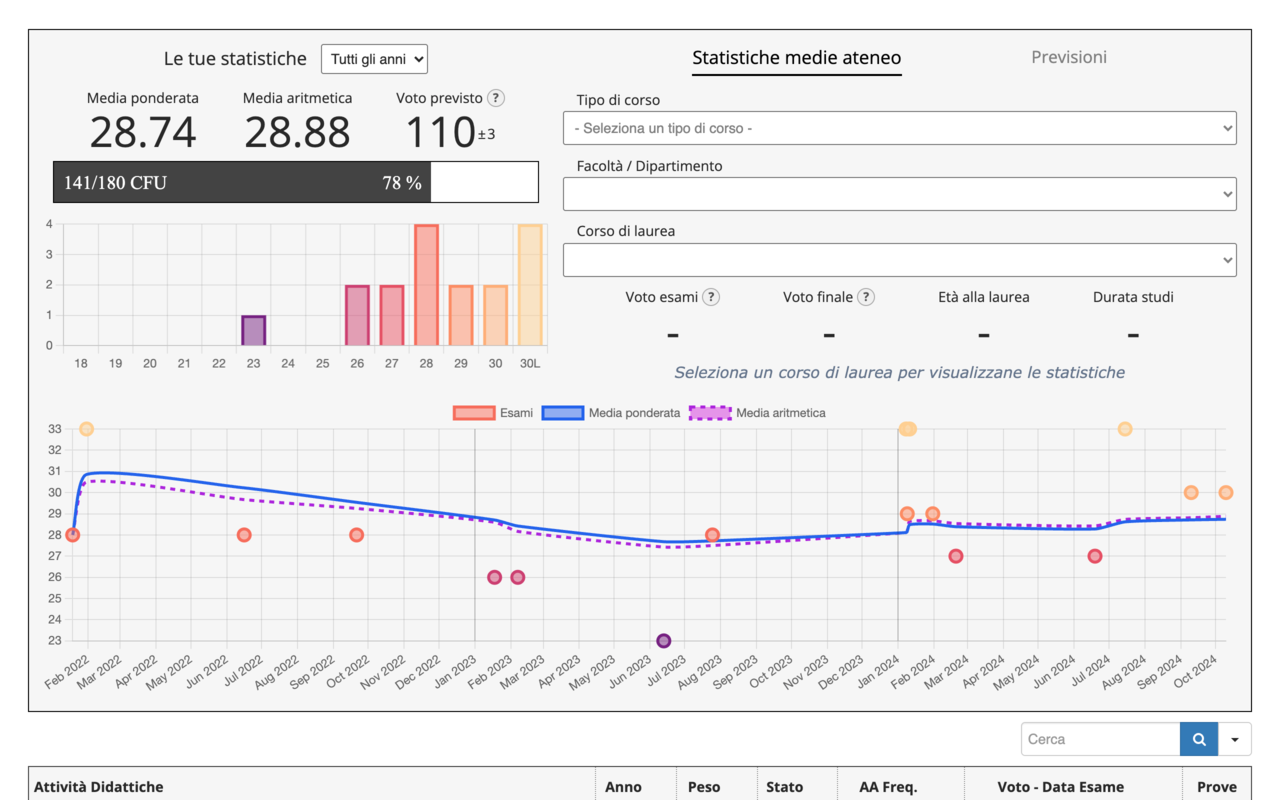
Specifically:
Metrics can be calculated per academic year or across all exams
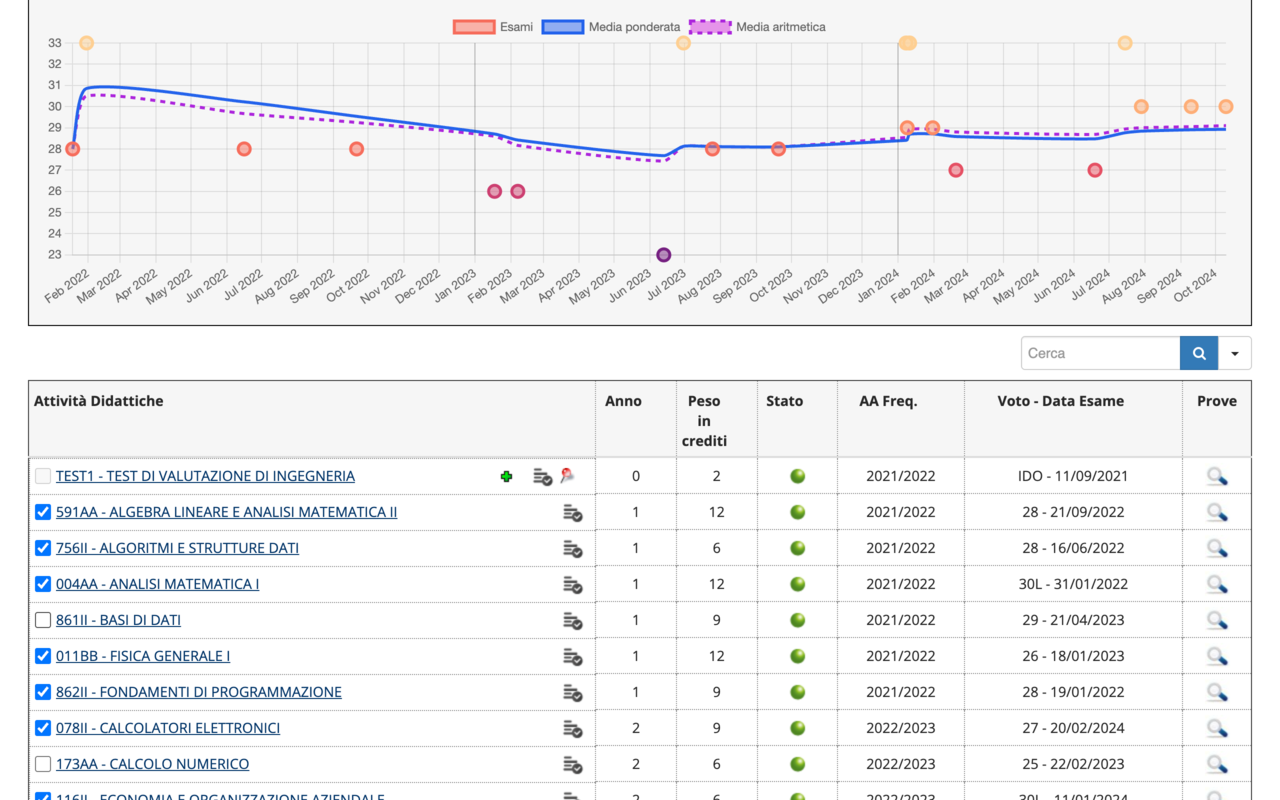
Individual exams can be excluded with simple checkboxes
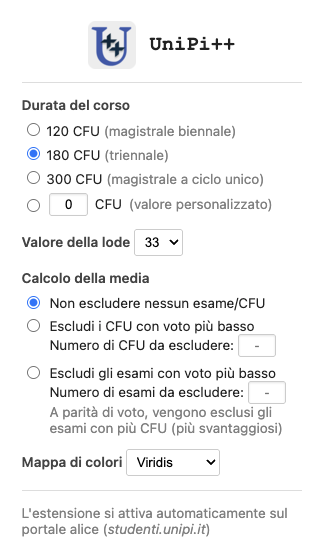
- All parameters (e.g., honors grade value, credit exclusions) and even visual settings (e.g., color map) can be fully customized via the extension’s popup menu
A dropdown menu allows you to compare your metrics with the average results of any degree program offered by the University of Pisa
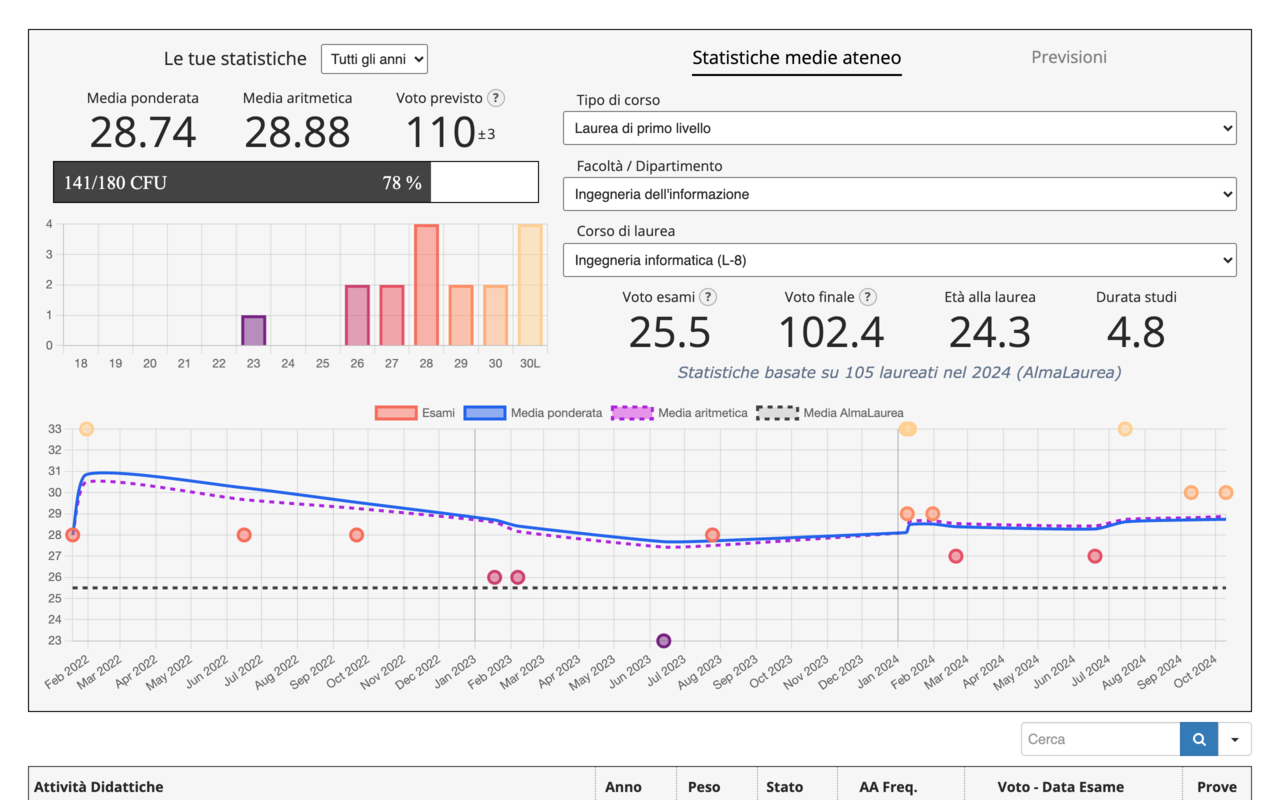
The reference data comes from publicly available statistics on www.almalaurea.it
An exam forecast section simulates how your average could change depending on the grades you think you will get on your upcoming exams
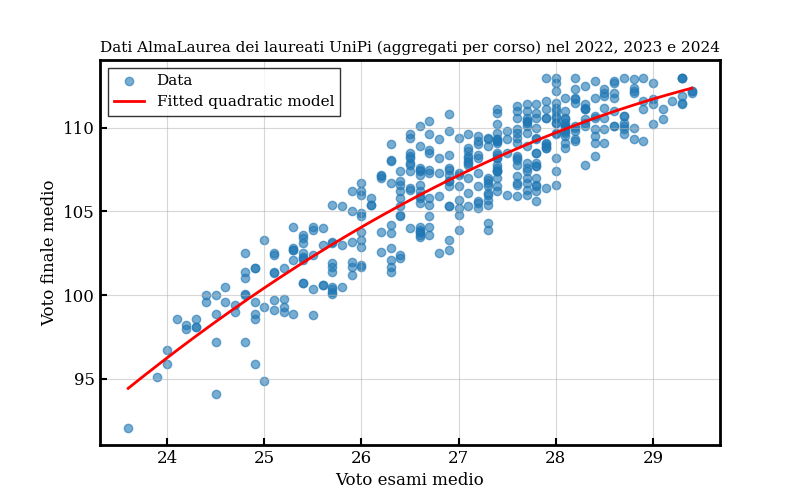
How is the final grade predicted ? A quadratic regression model is applied, trained on the relationship between average exam grade and average final grade across all degree programs offered by the University of Pisa in the years 2022, 2023, and 2024
Privacy
- The extension is only active on https://www.studenti.unipi.it/auth/studente/Libretto. It can not physically read data from any other websites
- The extension only reads the exam table (exam names, grades and credits) and nothing else
- All data is processed locally on the user’s computer. Nothing is ever transmitted to or stored on any external server